IT infrastructure is growing fast and becoming more distributed and complex. As a result, you may need to devote more attention and resources to ensuring it’s properly monitored and secure. One way that you can recognize the health of your infrastructure is through log analysis.
Log files contain a lot of valuable information that helps to identify problems and patterns in product systems. Log monitoring and analysis involves scanning logs, searching for patterns, rules, and deductive behaviors that represent important events that trigger an alert and send it to operations or security teams.
Monitoring and log analysis can help detect the problem before the user gets involved and identify suspicious behaviors that indicate an attack on an organization’s systems. It is also possible to help secure systems or users by recording the initial behavior of devices to identify anomalies that need to be investigated.
Basics of Security Event Log
Log collection and monitoring is the main activity of the security team. Gathering log information from important systems and security tools, then analyzing them is the most common way to identify unusual or suspicious events. Events that may indicate a security issue.
The two basic concepts in log security management are events and incidents. An event that occurs on an endpoint device within the network, and one or more events can be considered as an incident. For example, attacks, breach of security policies, unauthorized access, altered data or system without the consent of the owner are examples of security logs.
Applications, devices, and operating systems generate messages based on activity and data flow, essentially indicating how the resources within the network environment are performing or being used. Log messages contain information potentially traced to errors, anomalies, unauthorized end-user behavior, and other activity deviating from normal standards and benchmarks. These log messages, sometimes called audit trail records or event logs, can be collected, analyzed, and archived in a process known as log analysis.
Log Sources
There are many types of log sources around your environment and choosing which is important depends on your security monitoring use cases and how you prioritize them. Some examples:
- anti-malware software
- applications
- authentication servers
- firewallsintrusion prevention systems
- network access control servers
- network devices (routers, switches, etc.)
- operating systems
- remote-access software
- vulnerability management software
- web proxies
The concept of log aggregation
Log aggregation is the process by which logs are aggregated, classified, and decomposed from various computing systems, and structured data is extracted. Next, the data is put together in a format that can be easily searched and explored by modern data tools. There are common methods for collecting logs, and many log collection systems combine these methods.
Log processing is the art of capturing raw logs from multiple sources, identifying their structure, and converting them into a standard and stable data source, and has five steps:
Log Parsing
Each log has a duplicate data format that includes the data field and values. However, the format varies between systems and even between different logs in a system. Log parser is a piece of software that can convert a specific format of Log to structured data.
Normalization and Classification Log
Normalization integrates events with different data into a reduced format that contains common event properties. Most logs capture the same basic information, such as time, network address, operations performed, and so on. Categorization includes making sense of events, identifying log data related to system events, authentication, local or remote operations, and so on.
Improved Log Performance
Improving Log performance is adding important information that can make data more useful. For example, if the primary log contains IP addresses and does not contain the actual physical locations of users who have access to the system, a log aggregator can use the geographic data service to identify locations and add them to the data.
Indexing Log
Modern networks generate large amounts of log data. In order to effectively search and discover this data, it is necessary to create an index of common attributes in all log data. Data searches or queries that use index keys can be faster in size than fully scanning all log data.
Save Log
Log storage is evolving rapidly due to the huge size of logs and their exponential growth. In the past, log aggregators; It was stored in a centralized repository, but today, logs are increasingly stored in Data Lake technology such as Amazon S3 or Hadoop. Data lakes can support unlimited storage volumes at a low incremental cost and provide access to data through distributed processing engines such as MapReduce or powerful, modern analytics tools.
What is the ELK Stack?
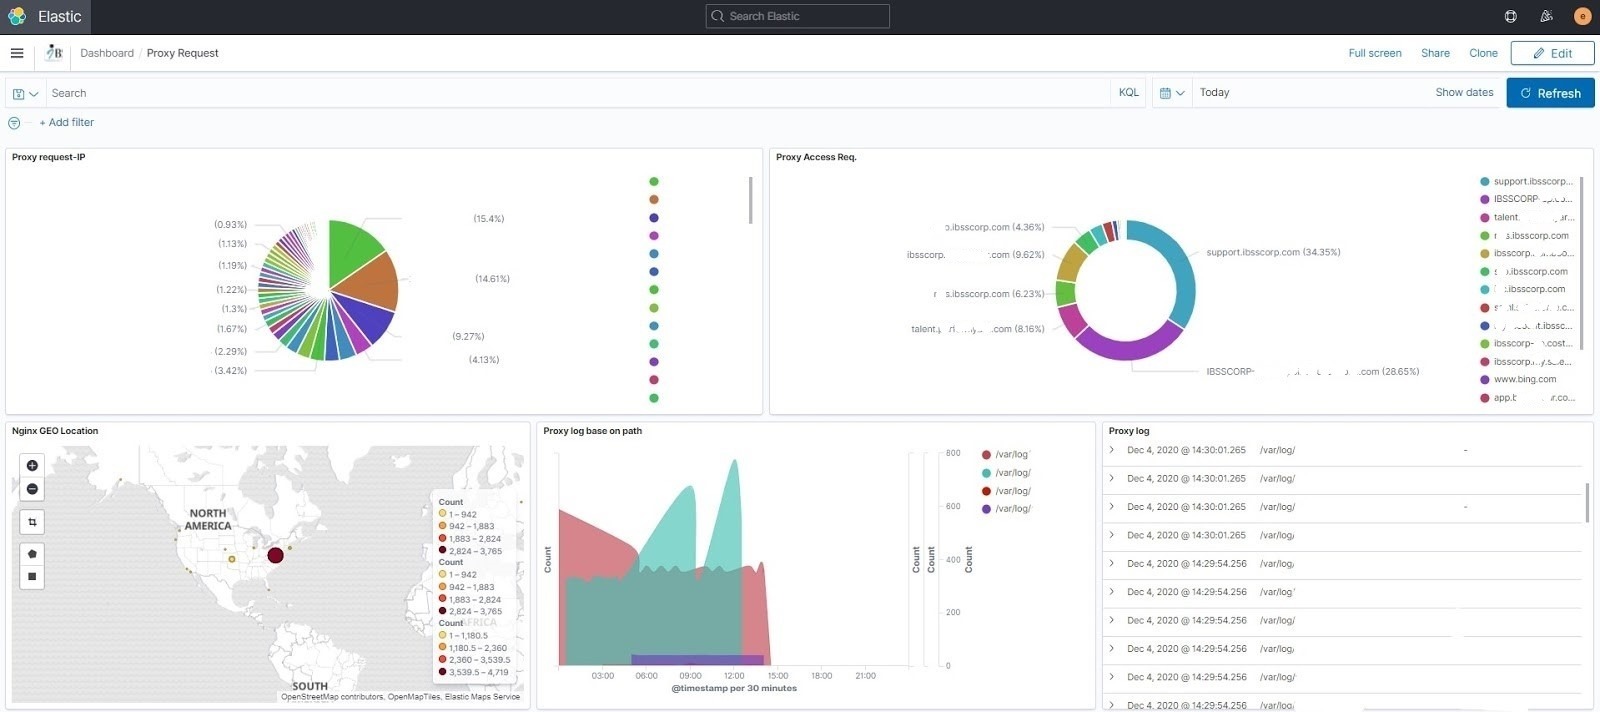
According to the Elastic Official Website, “”ELK”” is the acronym for three open source projects: Elasticsearch, Logstash, and Kibana. Elasticsearch is a search and analytics engine. The open source, distributed, RESTful, JSON-based search engine. Easy to use, scalable and flexible, it earned hyper-popularity among users and a company formed around it, you know, for search. Logstash is a server‑side data processing pipeline that ingests data from multiple sources simultaneously, transforms it, and then sends it to a “”stash”” like Elasticsearch. Logstash is a log aggregator that collects data from various input sources, executes different transformations and enhancements and then ships the data to various supported output destinations. Kibana is a visualization layer that works on top of Elasticsearch, providing users with the ability to analyze and visualize the data. And last but not least — Beats are lightweight agents that are installed on edge hosts to collect different types of data for forwarding into the stack.
The Elastic Stack is the next evolution of the ELK Stack.
How to Use the ELK Stack for Log Analysis
According to logz.io website, the different components of the ELK Stack provide a simple yet powerful solution for log management and analytics.
The various components in the ELK Stack were designed to interact and play nicely with each other without too much extra configuration. However, how you end up designing the stack greatly differs depending on your environment and use case.
For a small-sized development environment, the classic architecture will look as follows:
Image Source: Logz.io


